Instructional Technology Newsletter 33: Infographics
Melissa Anderson Morgan, Assistant Professor of Physical Education
Infographics: The Artful Display of Information
Benefits
Whether you are exploring dietary guidelines for Americans, investigating sources of lead in drinking water, or seeking to understand why people attend the arts, it does not take long to encounter infographics in today’s rapid, information-rich society. Infographics have become ubiquitous, in part, because they allow people to quickly communicate complex information and to share data in an engaging and visually appealing format. A 2018 study exploring the role of infographics in summarizing medical literature found that readers preferred infographics to text-only formats when reviewing summaries of medical information (Martin, Turnquist, Groot, Huang, Kok, Thoma & van Merrienboer, 2018).
As consumers of information, well-designed infographics can help us quickly glean key concepts from broad or mentally-taxing topics. As producers of information, infographics provide us with compelling modes to organize and easily share data with broad audiences via web sites and social media. These benefits are transferable into the classroom.
Uses Online and in the Classroom
In educational settings, infographics can add variety to text-heavy assignments like online discussion threads and paper-based assignments by allowing students to creatively express ideas through visual means. As an example, students in my online teacher education course recently generated infographics to communicate their SMART goals for technology integration to their classmates in discussion boards. They were also able to share their infographic images with a broader professional audience over Twitter and, in doing so, circumvented the 280 character limit.
Students producing course-related research papers can augment those text-based assignments with a “visual abstract” — an infographic representation of the purpose, design, and findings that could be used for a gallery walk in the classroom or as a visual aid during a presentation. In addition to data visualization, students might also generate infographics to illustrate a process, display a timeline, compare and contrast information, communicate a public service announcement, or summarize end-of-term reflections. Educators can leverage infographics to introduce new topics, augment lecture presentations, elicit debate on controversial topics, and build information literacy by inviting critique of existing infographics on websites and in readings.
For those new to infographics, a variety of user-friendly tools exist that offer access to free templates and features with the option to purchase upgrades. Several of the more popular applications include:
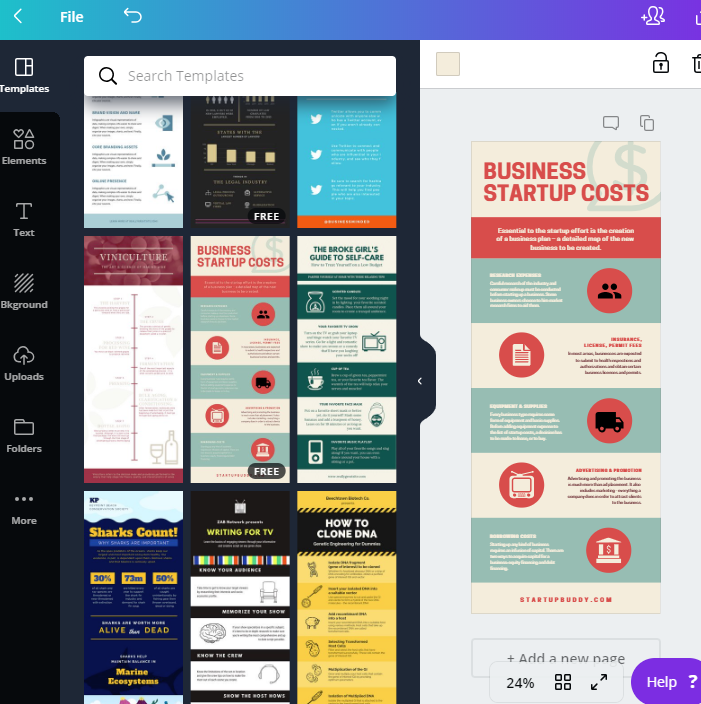
Source: https://www.canva.com
After signing up for a free account, users can either choose to edit one of many existing infographic templates, or they can design their own from scratch. To learn more about designing or evaluating effective infographics, see:
References
A Guide to Making Infographics from Scratch. (n.d.). Retrieved from https://easel.ly/introduction-to-infographics.
Infographic Design. (n.d.). Retrieved from https://www.canva.com/learn/how-to-design-infographics/.
Leung, I. (n.d.). 3 basic design principles for effective infographic making [blog post]. Retrieved from https://piktochart.com/blog/basic-design-principles-infographic/.
Martin, L., Turnquist, A., Groot, B., Huang, S., Kok, E., Thoma, B., van Merrienboer, J. (2018). Exploring the role of infographics for summarizing medical literature. Health Professions Education. 5. 10.1016/j.hpe.2018.03.005.
Ritchie, J. (n.d.). What is an infographic? Find out what they are and why they’re useful [blog post]. Column Five Media. Retrieved from https://www.columnfivemedia.com/infographic.
UNC University Libraries. (2018, May 24). Design guide: Infographics. Retrieved from https://guides.lib.unc.edu/infographics.
Previous Instructional Technology Newsletters are located here:
|
